
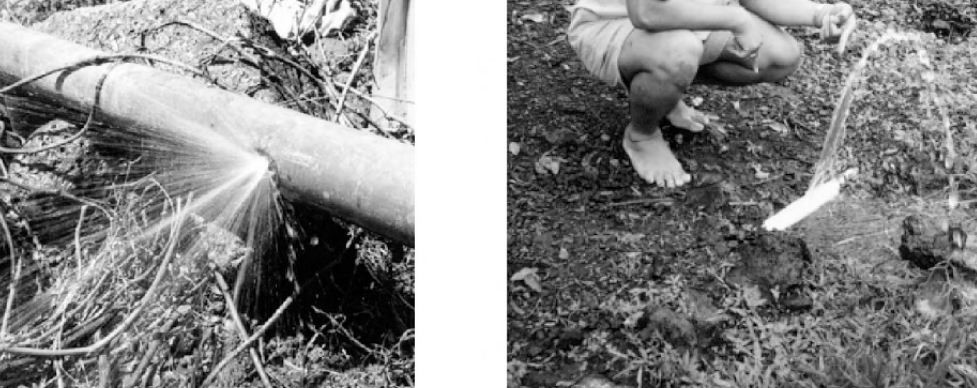
Pipe systems are vital features of modern society which are extensively used all over the world to transport and distribute fluids. Length of these pipelines is above 20 million kilometers already and every year, it is extended 40-50 thousand kilometers. A study by the Transportation Research Board (TRB) shows that pipeline transportation is the safest but not risk-free. Even without a natural disaster, most pipelines suffer deterioration due to many reasons such as leak, wall corrosion, tubercle growth, entrapped air pockets etc. Pipeline leakage has been a major problem not just because it involves cost due to downtime and repair expenses but also it includes loss of limited water resources, pumping energy, economic loss, and increased health risks due to escalating breakage rates and the possibility of intrusion by contaminants and environmental disaster. It is reported that modern cities typically loses 20 % of water from leak and other means which is a significant amount of loss. Studies suggests water loss of about 9-30% in Europe, 43% in Malaysia and 56% in Bangladesh. In North America, it is suggested that the unaccounted for water (UFW) is about 20-50%.
The physical mechanisms that cause pipe failure are very often complex and not well understood. Given the fact that pipelines are usually underground, little information is available about the modes of failure. Many cities worldwide have a large percentage of older pipes which is used for sewerage and water distribution. For instance, there are over 54 % of pipes older than 25 years and 24% older than 50 years in Germany. In Australia, the pipe system are generally newer and there are only about 47% of pipes that are 25 years older and about 13% are older than 50 years. An estimation made in 1992 shows about two-thirds of water pipes are metallic and in the remaining one third, about 15% are asbestos-cement and 18% are plastic, concrete and others while the newer pipe being installed are about 48% ductile iron, 39% PVC, and 12.5% concrete. In Canada, the problem is not as pressing as in other countries due to the relatively newer system but it is time to think so that the future of the water distribution network is better.
In the water distribution network, it is not easy to recognize leaks at the early stage and it is even more difficult to exactly locate the position of the leak. Knowledge of the former greatly minimize water losses and cost associated with it and the latter is crucial in taking efficient repair action. Currently, researchers around the globe have proposed various leak detection techniques ranging from simple inspection to use of software and hardware-based technique combining high tech devices and algorithm. We are looking into the acoustic method for leak detection in water distribution network formed using PVC pipes.
References:
[1] Farley, M., & Trow, S. (2003). Losses in water distribution networks. IWA publishing.
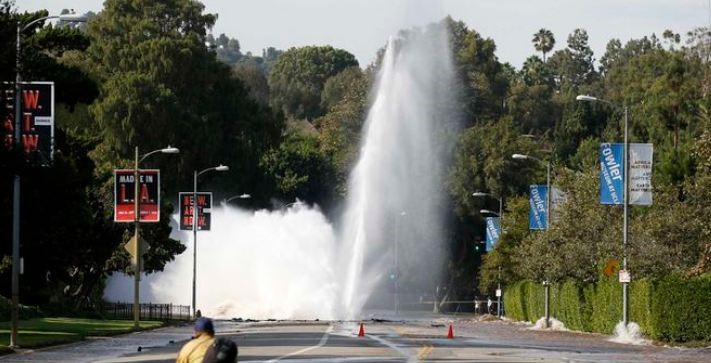
[2] Nina Golgowski. Water-main break floods ucla campus, sunset boulevard with 8 to 10 million gallons of water. Daily News, Online Search.
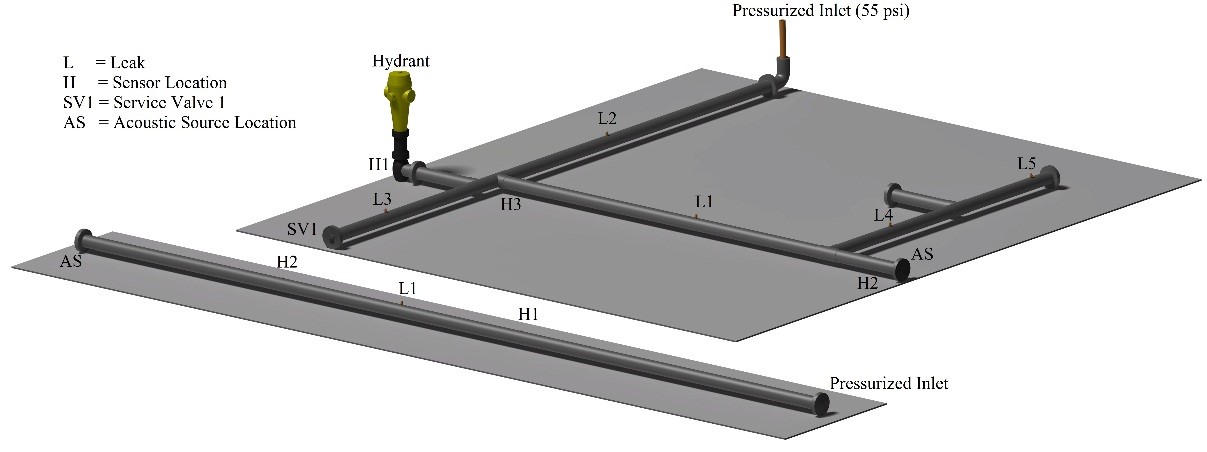
The experimental test-bed utilized consists of a series of PVC pipes, tees and a fire hydrant. The pipes are made of ’Grey Scale 80 PVC’ pipes with a 6 inch inner diameter, typically used in Canadian and US full-scale networks. A system is comprised of simulated leaks created at different locations, one service connection valve and a fire hydrant monitoring station where the sensor is mounted. The leaks are simulated using a 0.125-inch valve, while the service line is simulated using a 1-inch valve.
The system is pressurized by a direct connection to the water main flow from the City of Waterloo, to an average of 50 Psi that fluctuates from 45 Psi to 55 Psi, which is representative of field conditions. The simulated leaks located in different areas of the pipe create different leak signatures and for that reason the incorporation of bends and tees into the set up was deemed important to produce a data set with sufficient variability. In addition to the increased realistic water variability, the exclusion of a pump mitigates the saturation of the low frequencies zones important for small leak detection. The system is attached to a 3-inch service line from the city with a backflow preventer valve.
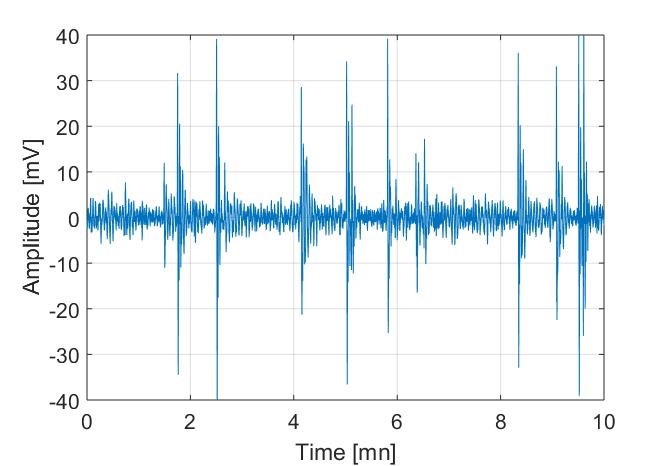
The leak pattern is weak and hidden in the ambient data variations.
The passive monitoring leak detection method we are proposing involves a purely data driven approach. For this we have reviewed the effects of preprocessing as well as different feature sets in order to identify which combination of preprocessing, feature engineering and machine learning methods best suit the water data under consideration.
Given typical time and frequency domain features the use of singular spectrum analysis as a preprocessing tool, when coupled with a one-class support vector machine classification algorithm showed significant improvements in classification. SSA is non-parametric, does not assume stationarity or linearity properties in the data and has only one parameter (called the embedding dimension) associated with its application. In this approach, a group of elementary components is assumed to be carrying the signatures related to the leak, while the remaining components form the background variation which is insensitive to the leak. This group is identified and used to compute the features. The identification of the sensitive elementary components is straightforward by referring to the singular spectrum.
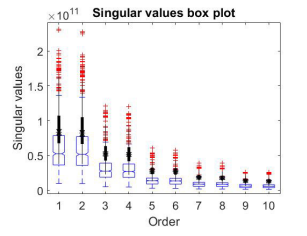
For a particular component of order I, a high overlap in the box plot means the component is not sensitive to the leak presence, which is the case of the first two singular values for example. However, the fifth and sixth singular values showing less intersection between their box plots, are more sensitive to the presence of leaks. This procedure, applied to the data corresponding to the quiet water system (valve closed), leads to the selection of elementary components of orders in I1 = {21, ..., L} to reconstruct the signal carrying the leak signature. When applied to the data corresponding to the noisy water system (valve open), it leads to the selection of elementary components of orders in I2 = {5, ..., 20} to reconstruct the leak signal. The leak signal is the sum of those chosen elementary components; features are computed using the obtained SSA components, instead of the raw signals. Enhancing the capability of descriptive features to discriminate between leak and non-leak data is essential for the purposes of leak detection. The use of SSA as a preprocessing tool allows for these underlaying features to be emphasized, this yields significantly improved classification accuracies when compared to the same features extracted from the raw (un-processed) hydro-acoustic time series data.
Work has since progressed to methods which eliminate the need for any preprocessing. A comparison between the acoustic signals created by the presence of a leak to the theory behind acoustics created by a vocal tract is under review. The effectiveness of linear prediction in representing the underlying structure of the acoustic data was reviewed in order to determine its effectiveness as a representative feature set.
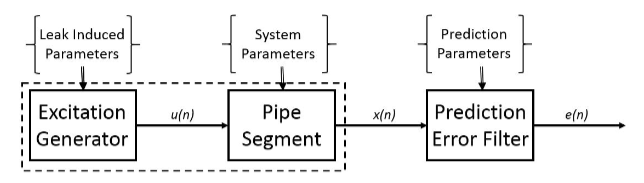
The principle of linear prediction is a simple method to capture the underlying formative responses of a linear system. Acoustic signatures caused by leaks can be assumed to follow the assumptions of plane wave theory (away from the source) and this makes linear prediction a powerful tool to capture the primary resonant responses of the fluid-pipe coupled linear system. The source/system model for linear predictive analysis of hydro-acoustic signals in water filled pipes is illustrated in Figure 7 where the acoustic signal x(n) is modeled as the output of a linear, slowly time-varying system excited by u(n).
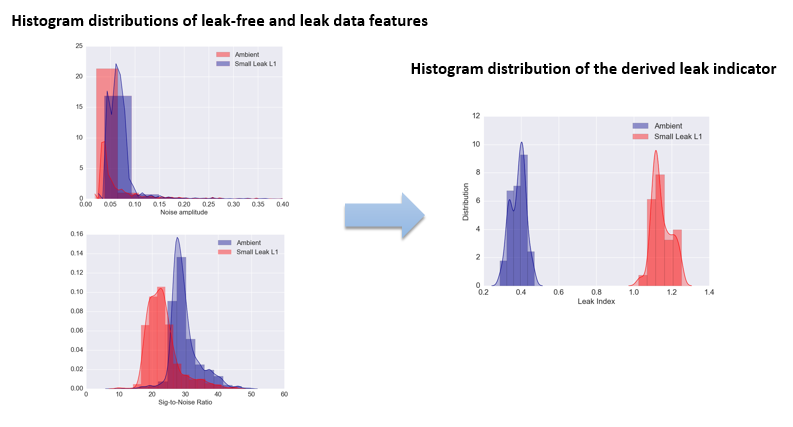
The sensitivity of the linear prediction coefficients as features can be easily seen in Figure 8, for both as quiet and high noise scenario the histograms of the leak and leak-free cases are clearly separable.
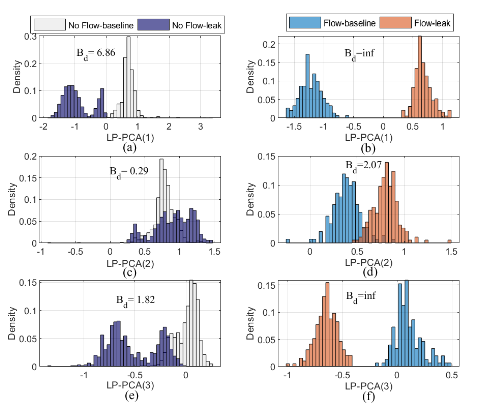
These features were so clearly separable that a simple multivariate GMM-EM classification method was able to be used to yield ideal classification accuracies. Work on this in ongoing with field trials currently underway.
Any activity that involves the extraction of water from a WDN will generate a temporary pressure change, or transient, in the system. The causes of pressure transients in WDNs can include general usage, maintenance activities, as well as failures in the pipe material, resulting in leakages and burst events. While most pressure fluctuations are harmless, larger pressure surges, or water hammers, can cause damage to the pipe network.
Since pressure transients are a type of hydraulic phenomenon, it is intuitive that their detection may involve techniques that use the hydraulic data in a system; in this case it is the hydraulic pressure itself. We are exploring methods for event detection using this data that can be implemented in real-time that can be integrated with an IoT framework that will provide operator notification for large pressure surges in a municipal WDN.
Tests in the laboratory testbed involve inducing transients using a solenoid valve, and recording the signal on a Raspberry Pi-based device with a pressure transducer. The identification algorithm extracts relevant features such as the cumulative sum (CUMSUM), RMS, kurtosis, and skewness, and uses SPC techniques to compare them to 3-sigma thresholds derived from ambient conditions.
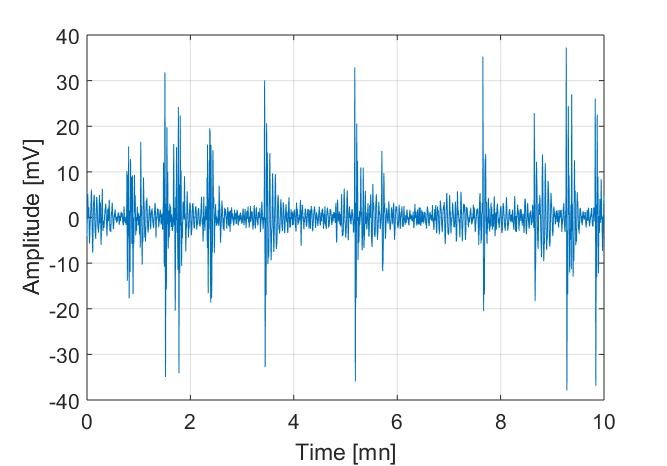
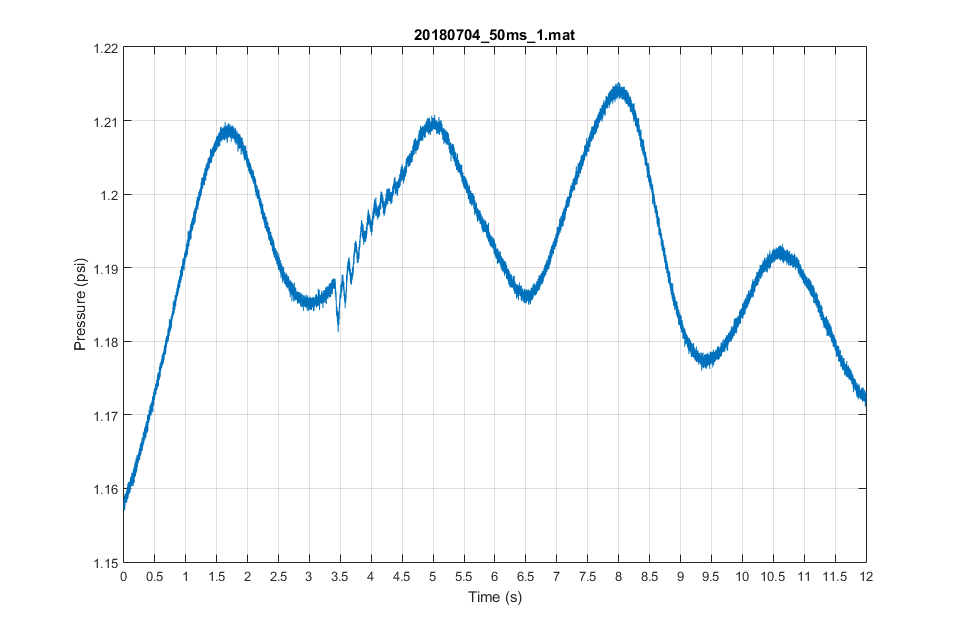
An example raw pressure signal is shown below, with the transient, induced by rapidly opening and closing the solenoid valve, at around the 3.5s mark.
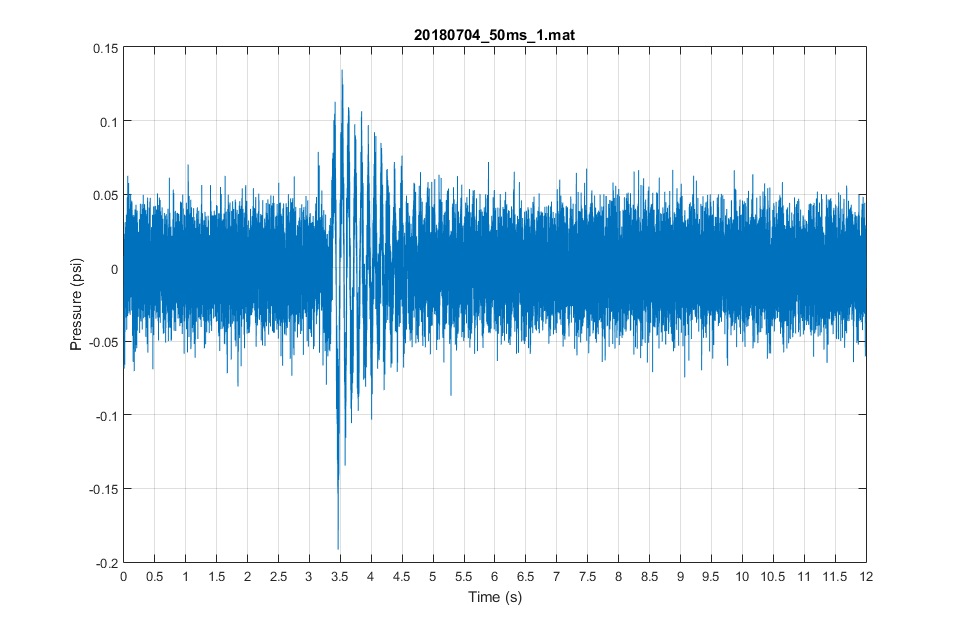
Some focus is placed on reducing processing power in order to increase transient detection speed and minimize power draws from the monitoring system. The sampling rate could be reduced to as low as 64Hz and still retain accuracy in transient identification. Further data pre-processing involved filtering out the governing low-frequency artifacts in system, and data de-trending. The resultant signal is shown below, with a much clearer view of the occurrence of the transient.
Preliminary tests show that by looking at how many exceedances are shown in the feature vector for each 0.5-second time interval, the transient can be detected with a great degree of accuracy. The more exceedances registered, the more likely that a transient has occurred. The transient severity can be inferred from the amount by which the features have exceeded the thresholds.
It is apparent from the literature that events associated with large changes in the hydraulic conditions can be detected using data acquired from local inspections; however, what remains unclear is whether it is possible to discern background leaks producing weak acoustic signatures, using long-term data acquired from monitoring programs representing a large variability in the hydraulic conditions and the associated acoustic noise conditions.
We explore the application of association rules mining (AR) as a data-driven modelling approach for such continuous monitoring of WDNs with the objective of leak detection. Association rules have previously seen applications in finding patterns in large complex datasets. An association rule pattern reveals combinations of events that occur at the same time. Such events are of categorical type, and AR mining has been proposed and traditionally used to extract information from databases of non-numeric, categorical data. We propose a novel method to tailor AR mining to continuous numeric time-series, such as acoustic sensor measurements used for leak detection. The set of extracted rules can be interpreted as a statistical model descriptive of the features space, where it can also enable dimensionality reduction, information extraction and anomaly detection. Particularly, the AR model is used to design an efficient leak indicator from a large data set of acoustic measurements taken from WDN under a wide range of operating hydraulic conditions.
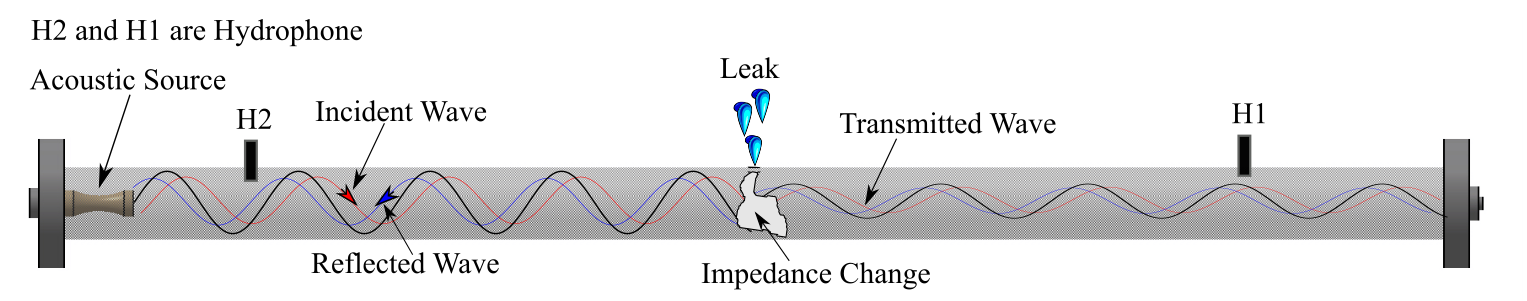
The active acoustic leak detection method we are proposing involves injecting an acoustic signal into the network and using sensors placed at several locations, the resultant signal is recorded and analyzed to characterize the network. The basic idea is if a traveling wave impinges with any defects inside the pipe, then part of the wave is reflected and part is transmitted as shown in Fig. 11. These reflection and transmission occur due to a change in impedance in the local region of the network. Hence by periodically monitoring the impedance magnitude at the source as well as wave reflection and transmission, any defect or blockage in the system may be characterized. The acoustic source we are using is capable of sending a wide spectrum of the acoustic signal. The advantage of using such a source is that the driving frequency can be carefully selected so that it does not fall in the same frequency region as background noise. Moreover, in the right conditions, in an underwater environment, a low-frequency wave can travel thousands of kilometers as they suffer less attenuation than high frequencies.
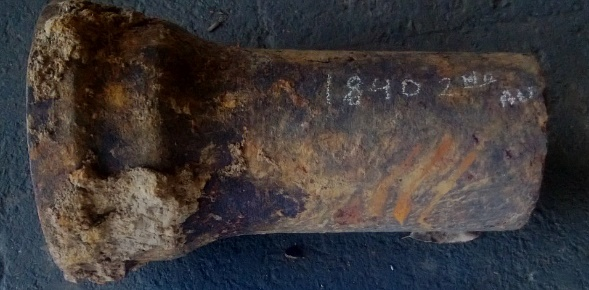
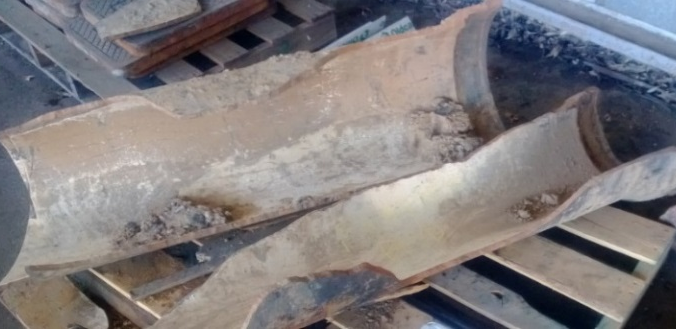
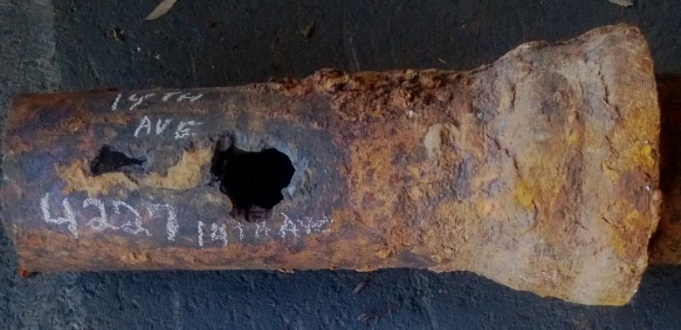
The failure scenario of a pipe has two different aspects: strength capacity and strength demand. The strength capacity of a cast iron pipe depends on deterioration due to corrosion and consequent graphitization. Graphitization significantly embrittles cast iron and makes it less fracture resistant. The strength required to endure external loading, e.g., due to soil movement, internal and external corrosion, temperature, pressure fluctuation and external loads falls into the category of strength demand. These loadings on corroded pipes can cause different modes of fractures, as shown in Figure 13.
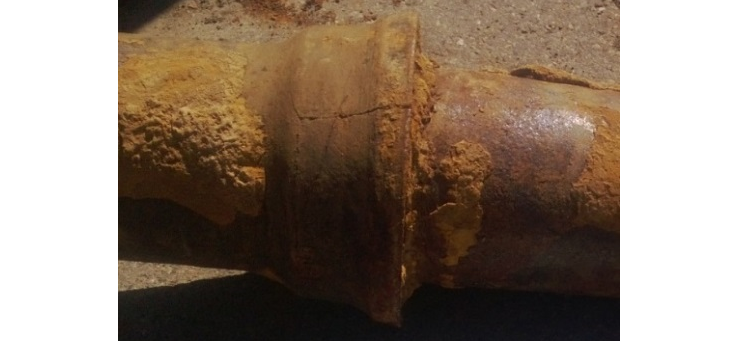
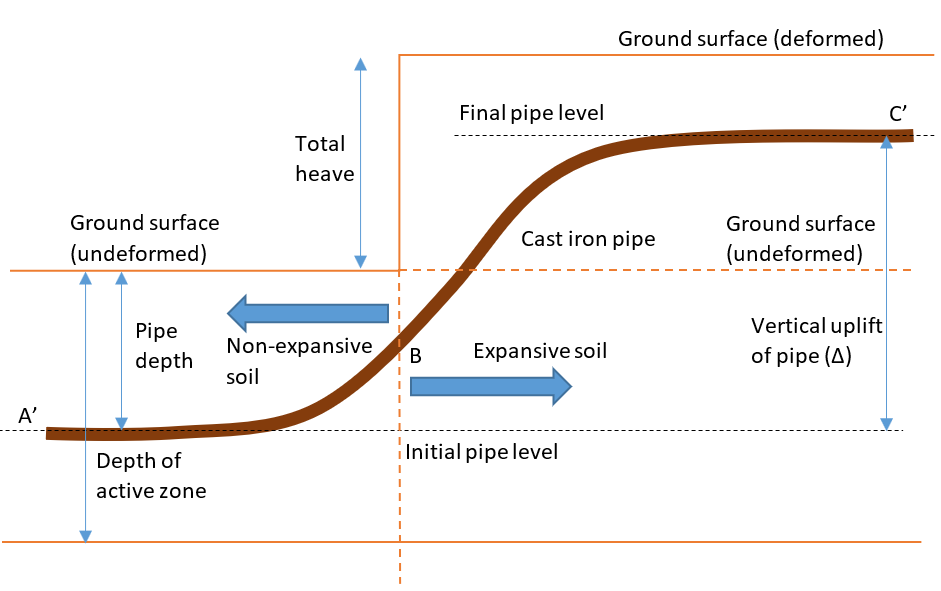
Pipe failures are influenced by several factors and the dominating factor that causes failure is difficult to predict accurately. The assessment of strength to endure external loading is of paramount importance. While much of existing studies have focused on the aforementioned loading scenarios, flexural failure of pipes caused by soil expansion (differential movement), shown in Figure 14, has received relatively less attention. Such failures are a result of circumferential stresses induced through differential expansion of soil. A statistical analysis shows on average 70% of cast iron pipe failures are circumferential, which explains the significance of flexural failure. In the current study, a simple yet powerful solution strategy is developed to analyze pipe bending and implemented through finite element analysis. Additionally, an analytical formulation is proposed using a beams-on-elastic-foundation approach together with Hetenyi solution to support the predictive model.
Buried pipelines operate in a state of anonymity until the level of deterioration is severe enough to cause failure. The life expectancy data indicates that pipes are aging and going to fail soon. Age-based replacement is an expensive proposition; especially considering the capital constraints faced by most municipalities and the disruption, this might cause to the normal life of the citizens. A risk-based approach to replacement is a vastly preferable option, especially when combined with measurement of stressors that can be monitored. Such a monitoring system can inform the decision-making process on a real time basis. Prior to developing such a risk-informed decision support system, it is crucial that both the mechanics of failure as well as the stressors contributing to failure are properly understood and modeled.
Given the context, the main focus of this work is to understand the main drivers of pipe fracture, first from a mechanistic standpoint. Once this is accomplished, the second task is to develop a risk-based assessment methodology, which ranks various regions of a pipe network based on the risk factors or stressors. This decision support framework will be informed using a monitoring system, which can aid in the measurement of the risk indices or parameters and support the process of risk-based decision making in the context of capital replacement or maintenance. With this background, the specific objectives of this work are:
 Roya Cody
 Marshal Deep Kafle
 Piyius Raj Singh
 Nina Feng
 Jinane Harmouche
 Pampa Dey