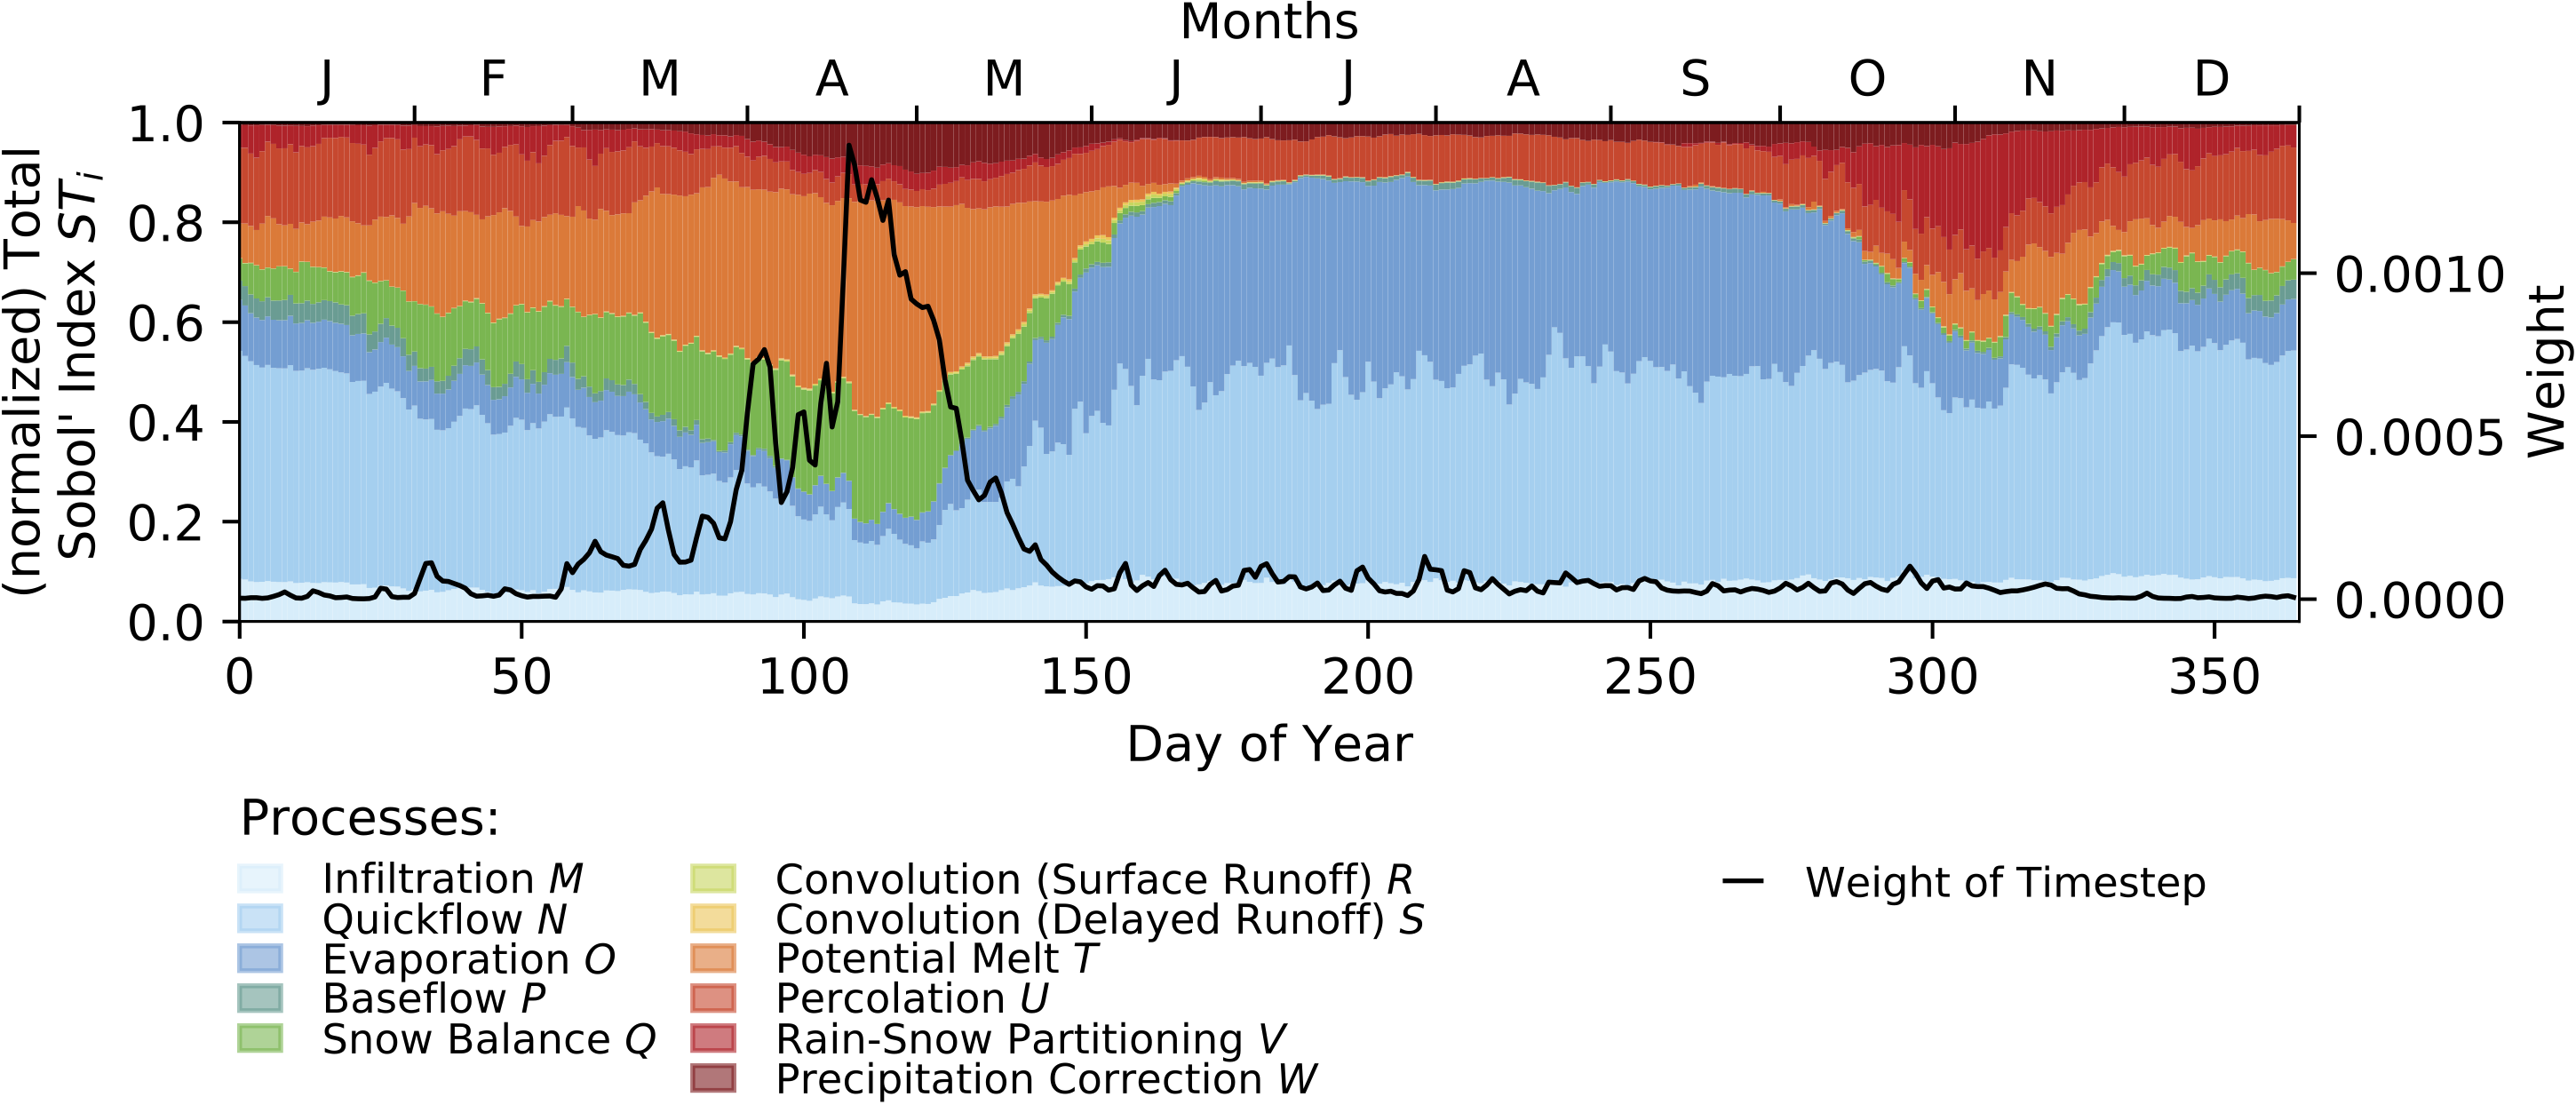
Time-dependent Sobol' sensitivity of hydrologic processes
The plot on top is showing the results of the Sobol' sensitivity
analysis of the hydrologic modeling framework Raven. The
sensitivities of eleven processes are shown as their averages
per day of the year (colored bars). The simulation period is
1991 to 2010 while the first two years are discarded as
warm-up period. The sensitivities are normalized such that
they sum up to 1.0 at every day of the year. The sensitivities are
variance-weighted averages. The (average) weight of each day of
the year is shown in the plot below (black line). The weights
for every time step are determined by the average simulated
discharge at this time step.